Dave Burnett here with AOK marketing; I just wanted to continue explaining Google analytics and how we use it for our customers.
And not only that but hopefully giving you some insights as to how best to use it yourself. So what I’ve got here is I’ve got up at Google merchandise store.

If you go to Google and you type in Google demo analytics account, you will be able to add this to your account and watch and move along as, as you wish, or do some of the exercises that I’m going to talk about here shortly for yourself.
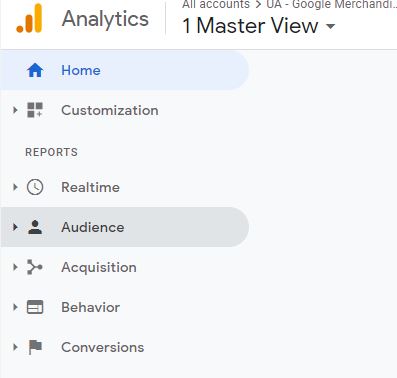
What I’m doing is I’m going down the left-hand side here. So the left-hand side, if you haven’t, if you’re not familiar with this, this is the overall front interface of Google Analytics, and we’ve covered real-time already. So now I’m going over audience.
The audience tab is critical when it comes to targeting your customers. So here, in the audience overview tab, they’re broken up into different sections. So these are the number of users by day. And they also give you a full summary down here, who your new users are, how many sessions there are number of sessions per user, different page views and pages per session. So whether or not you got a new visitor returning visitor is over here on the right, along with this session duration and the bounce rate.
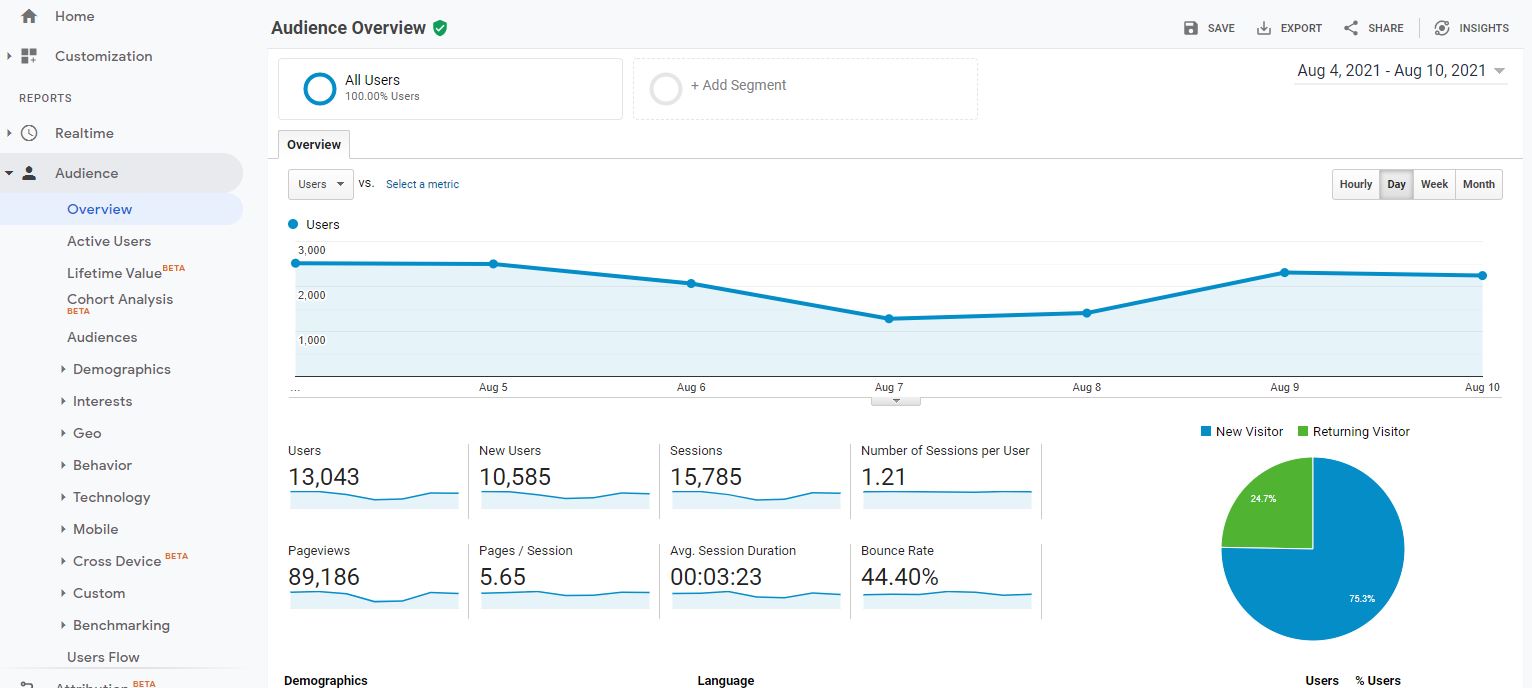
Now just wanted to touch base on bounce rate for a second. Bounce rate is something we often get asked about, and people say, oh, it’s got a really high bounce rate, or it’s got a really low bounce rate. Usually, anywhere between kind of 40 and 60% bounce rate is where we like to see a website, of course, the lower, the better, and what about is as people come to the website, and then they hit the back button, they bounce back off, and it’s not necessarily a bad thing. And this might be a little contrary and in terms of the view, but if you have the answer to their question on that particular page, what’ll happen is when they bounce back off, they’ve found what they were looking for. So it’s not always a bad thing, but you want to try and keep it as low as possible.
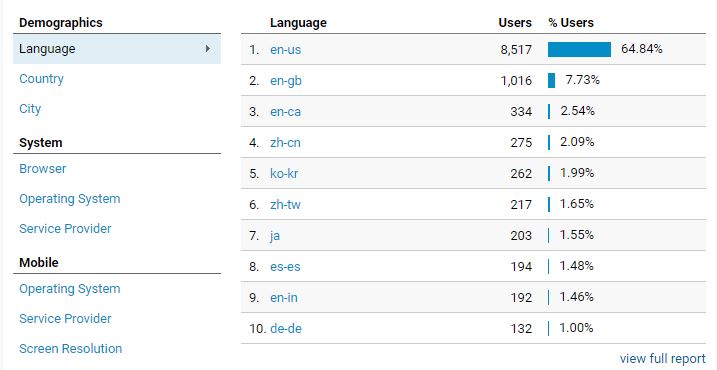
So also, in this audience overview, you got your demographics, language, country, city, what browser operating system, and service provider., mobile and you also have language reporting.
And all of these things, if you click on any of them, it’ll change the information associated with what you clicked on.
To bring you up to speed, the information we are reviewing is from the Google merchandise store in this demo account. Merchandise meaning t-shirts, hats, pens, all the good promotional products that they sell are there. So this is where the information is coming from.
Continuing with location, even if we go down to the city level, so New York, San Jose, and actually as I’m here, you can see a location that is ‘not set.’ That means that Google couldn’t resolve where actual traffic came from. So just so that you know what all that is.
We can also look down here at the browser. This is important because it makes sense that Chrome is a major browser, but interestingly Safari is a major browser as well. And given that most of the traffic coming to this store is from Google employees. So that’s an exciting discovery, people using the Edge browser, or Firefox, or opera.
Other exciting stuff that you see here is operating system, you know, lots of windows users, lots of Mac users service provider is not set mobile. So you know what operating system they’re using iOS versus Android. And then that’s, that’s also very interesting given that as a Google product which the service provider is, it’s ‘not set.’
And then what screen resolution people are using. Screen resolution is fascinating because depending on how your website is converting, there may be conversion issues at different screen resolutions.
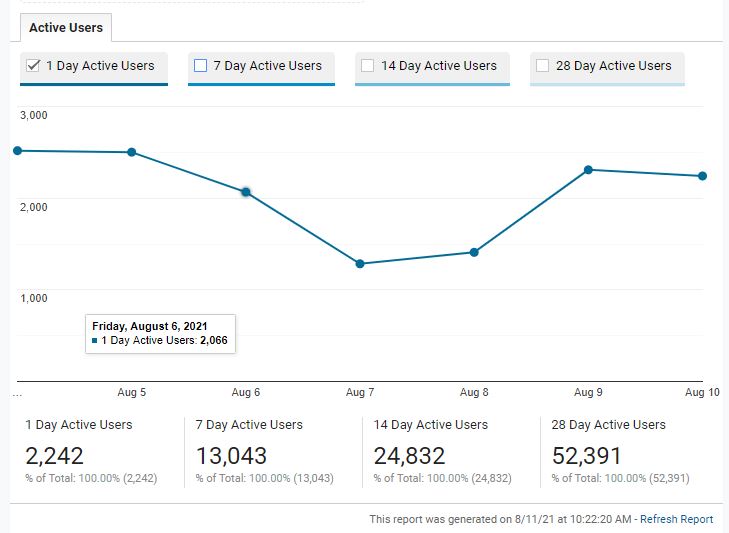
So we can touch base on that in a minute. Right now, let me take a look at active users. These are the number of daily active users. You can go seven days, 14 days, 28 days, to see how many people are active on the site. If this trending up or down is lifetime value that sometimes takes a minute to load, you know, revenue per user lifetime value. So you’ve got 88 now Google tracks up the 90 days.
And it’s fascinating to see this on a revenue per user. So depending on how often and how long you can get the comeback, that’s a good thing. So if you see organic search acquisition channel, no, this is the percentage of total revenues over here on the side. So in the last 30 days, whatever they’ve got or sorry, 90 days, they’ve got $6 million worth of revenue, which strikes me as a little high. So we’ll have to double-check what exactly is the revenue numbers are.
Once we get down to the conversion side of things cohort analysis, if there’s any particular cohort, you know, day, one, day, two different conversions, all users. So acquisition date cohorts by user retention. So the cohort type acquisition data is the only one set up, but that’s okay. So that’s the number of users and the timeframe from them. And then when you take a look at audiences, if they have the different audiences set up, which they don’t, you can set up different audiences here and segment that way.
We are now moving over to the demographic side of things. This is very interesting because in this particular site, basically, the higher the bar and the darker the part of the pie chart over here, the better. So, you know, users, 34 and a half percent of users are 25 to 34, 20 5% are 18 to 24.
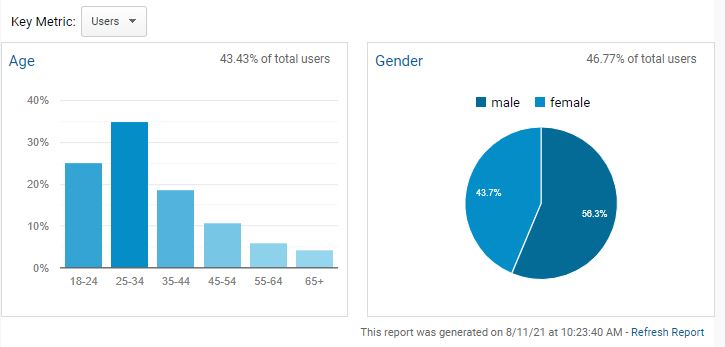
So between those, you’ve got 60% of your users between 18 to 34, which is very interesting, and most of them are male. So if you wanted to get more specific, you could do some marketing campaign defined as males between 25 and 34, and you would get a good chunk of who you’re looking for.
Now, the other thing to look up here is the percentage of total users. So Google analytics also, depending on the volume associated with the date range you’re looking at, and the date ranges up here. So this is June 2021.
So you can narrow it down by age here as well to get your total users. And then, you can see how many transactions and how much revenue there is. So if you wanted to sort it that way, so this revenue number $20,000, a percentage of the total for 9%. So this makes a lot more sense than the $6 million we were looking at before. So you know, we’ll have to dig in deeper as to why Google analytics is showing multiple things, maybe lifetime value of all purchases, as opposed to the last week and then gender same thing here, male versus female, very evenly split is also interesting.
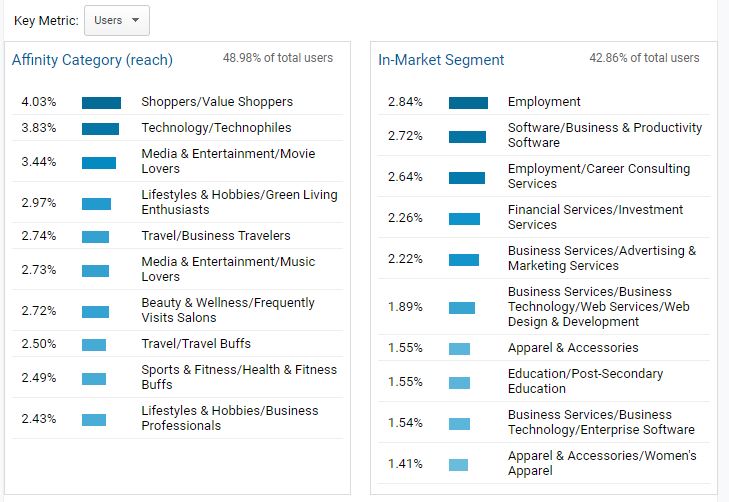
Now over here on the left, again, you can get into different interests. Now, this tends to be suitable for your tracking and utilization of your display ads or your YouTube. If there’s something that kind of stands out, you could target people who are interested in arts and entertainment who are shoppers, who are shopping for software business productivity software.
So you could narrow it down. It makes sense that people who primarily work at Google, that’s where most of the purchases would come from, would be interested in a software business productivity software, right? So that was several different things that you can get into there.
And then here you are by affinity category, you can sort by revenue. So value shoppers, then technology, technophiles, travel, travel buffs, all this, and then you get general.
So it’s hard to, you know, really narrow it down. In some cases, then you go to in-market segments again, sorted by revenue. And again, you’ve got employment, career consulting services, business related, staffing services, gifts, holiday, AMS, and decorations.
The question is whether or not there’s enough information on your Google analytics to generate anything in terms of an audience here and whether or not you’d be able to track them and target them more effectively. So when we sort this by revenue, you know, there’s not much helpful information there. But, still, if we look at geo by taking a look at language and location, English us, while let’s sort again by revenue, English US, English Canada.
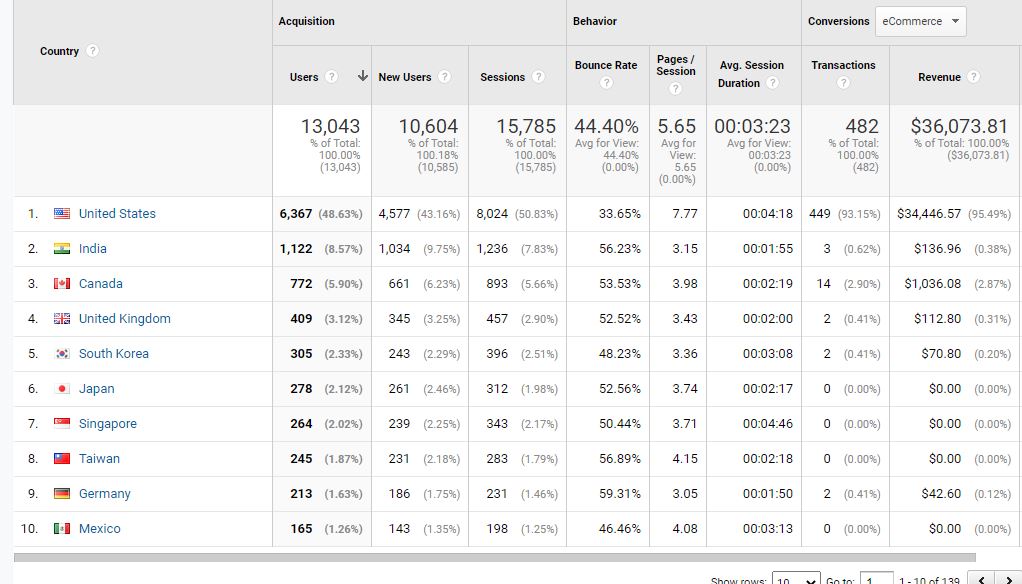
The United States has got the most revenue, then Canada, Mexico, UK Sweden. It’s interesting. So there’s selling product from all over the world.
Now, one of the other exciting things is the e-commerce conversion rate. So you’ve got a 3.4, six conversion rate for everything, but you take a look by location 7.3% in the US 8.3, 3% in Guatemala. But you know, some of these other ones are one, 1%, 2%, that kind of thing.
We often get asked, “What’s a reasonable conversion rate?”, and it depends on what type of product and what you’re selling and how your website’s set up and how easy it is to buy from how expensive it is. So there’s no real easy answer, but just in general, one to 4% conversion rate is what we often see in excellent performing campaigns.
On the other hand, you see 10, 20% and poor campaigns. You know, point whatever of a percent. So there’s a lot of different variations when you get into the behavior side of things here, new versus returning.
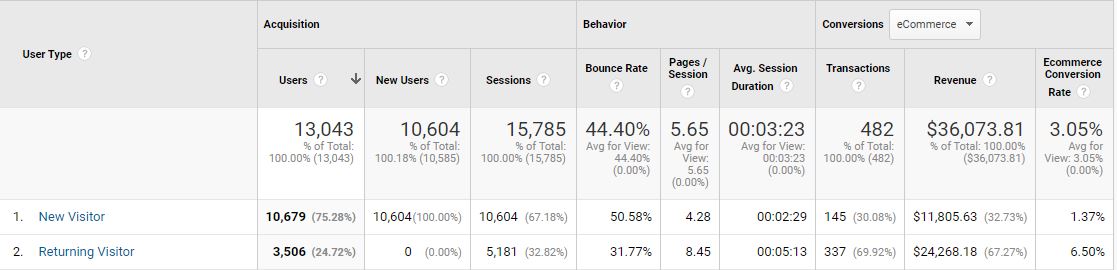
Returning visitors convert at 6.81% for $26,000. So again, the row at 40 grand in revenue, new visitors or 15 grand. So this is just something that we always try and stress important to try and get people to come back to your website, really, really important to try and get them back. So frequency and recency are important, how many sessions and how many page views engagement, how many pages they see.
There are session duration bucket here, one to 10 or zero to 10 seconds, 11 to 30, you know, and how many page views there are. So there’s a lot of different things that longer. You can get people to stay on your site. Often the more they convert. And sometimes, it’s just that you have a long conversion process, and you want to shorten that up as much as you can. It takes a few minutes to just kind of go through and check out and enter your credit card information, et cetera, et cetera.
Often that’s just the reality of the situation session quality. So this is an exciting thing.
Let’s move on to sessions with transactions. You can take a look at all the different sizes of the sessions here and then figure out exactly how many sessions did it take them before they transacted, and what buckets do you ideally want them to fall in?
The vast majority of session count with transactions is right here, two to five sessions without transactions, much smaller. So that’s where you’re, you know, two to five is 301. That’s the cumulation of all of these here in the middle together, but that’s really, where you’re going to get them back to get them to convert.
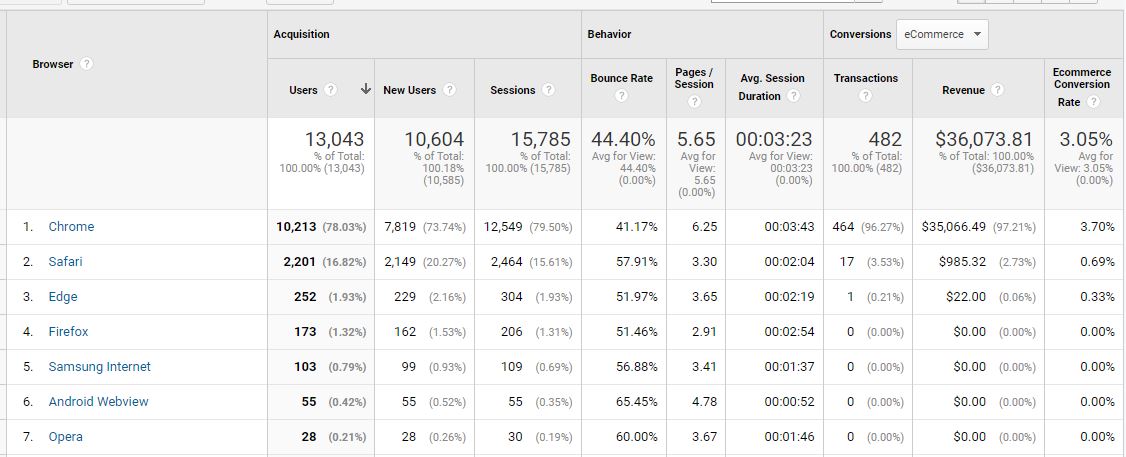
When we took a look at the technology, browser, and operating system, Chrome is a clear winner here, followed by Safari.
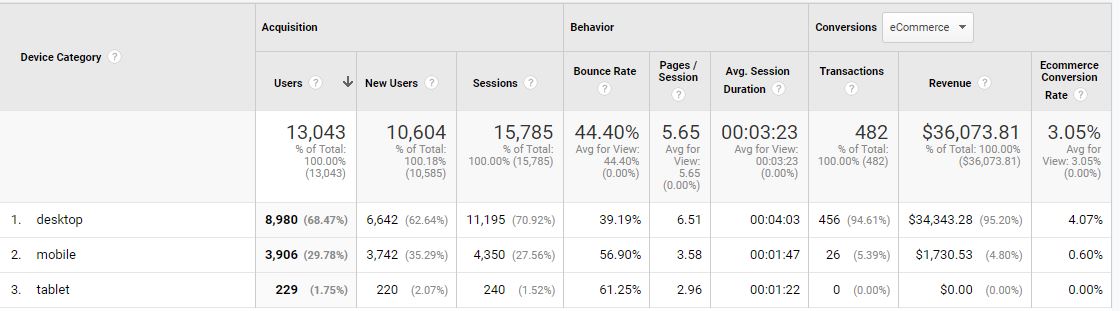
You want to see who converts the most by revenue. We often see purchases on sites like this that desktop is the highest converter.
So you got desktop here. Now, when you look at the sessions, 95% of conversions came from desktop, but only 60% of traffic. So you said 30% between mobile and tablet, but they’re just not converting.
When you’re optimizing your experience, even though mobile-first, you want to make sure that you optimize for where and how people are transacting on your site. And then you take a look at the revenue for a by mobile, interestingly in apple, iPhone has the highest transaction number of transactions. And then when you, they also have cross-device, but we don’t find that necessary. Yeah. We don’t have permission to do that, but you can do some cross-device tracking if you have permission.
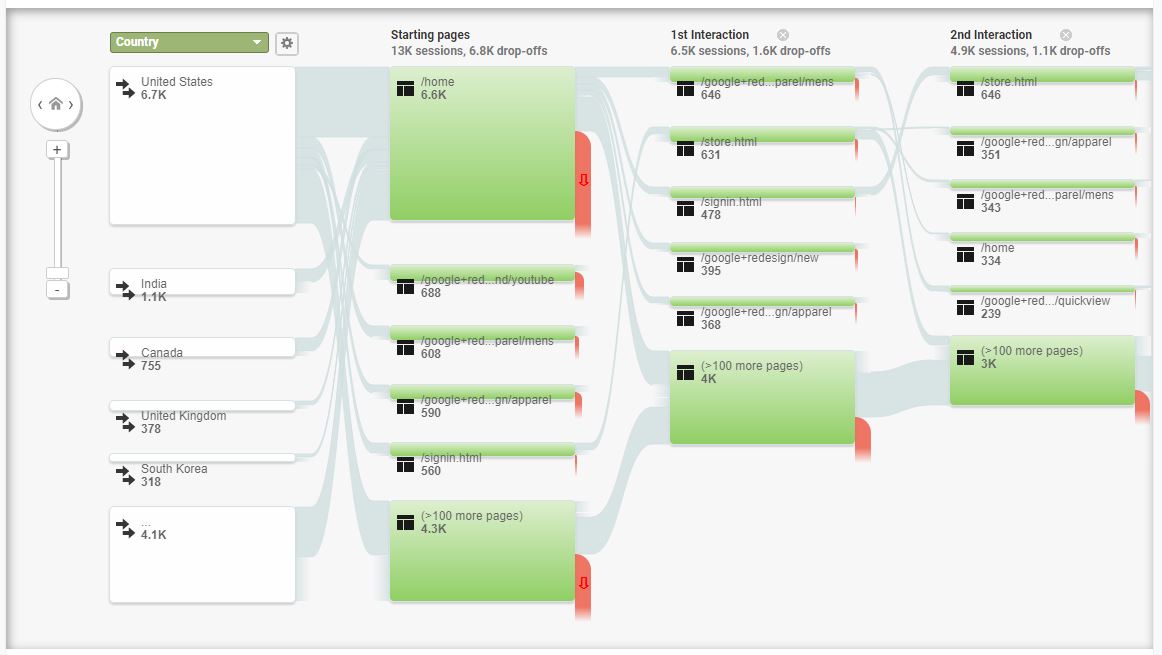
Another exciting thing is the user’s flow. So you can see where if, for example, you’re starting with country, you have all of your different options here. So if you’re starting with your country, how many went to the homepage? How many went to this Google redesign apparel men’s and then, how many people went into the quick view and then, here to redesign apparel.
You can follow people through this, and you can zoom in and expand out and all kinds of exciting things. And you know, this red section or people who dropped off. So at each step in the funnel, you can see how many people dropped off and where.
Hopefully, that gives you a quick overview of what you’re looking at when looking at the different audiences.
The goal is to try and get as much information as possible about the audience and understand who they are; male, female, age, devices used, geography, and target customers who are converting better down the road. So thanks again; I really appreciate it and hope you enjoyed the video.